How to promote the value of study in the humanities and how to give a convincing public account of the benefit an undergraduate might expect to receive from majoring in a humanities discipline have been perennial questions for academic humanists and humanities departments. Both questions gained urgency after 2009, when programs began seeing declines—in some cases reportedly precipitous—in the number of undergraduates declaring a humanities major. The anecdotal reports were connected to currently enrolled undergraduates. But they foretold declines that appeared two or three years later in the systematic degree completions data that the federal government collects as part of the Integrated Postsecondary Education Data System (IPEDS). As made available on the National Science Foundation’s WebCASPAR site, IPEDS degree completions show steep downturns in English and history since 2012, following a long period of relative stability through the 1990s and early 2000s. The other core humanities disciplines—languages other than English and philosophy and religious studies—saw similar, if less dramatic, declines (fig. 1). The recent decline has eroded 48.6% of the increase in bachelor’s degrees English saw after 1987 and 39.3%, 22.2%, and 25.6% of the increases that history, languages other than English, and philosophy and religious studies, respectively, saw until as recently as 2012.
Fig. 1.

Figure 1 shows a twenty-nine-year span of data back to 1987, the year the United States Department of Education introduced the Classification of Instructional Programs, which categorized the fields of study in which institutions confer degrees with greater detail than before. (In the Department of Education’s pre-1987 field categorization, philosophy and religious studies was not broken out as a separate discipline, but included in “other humanities.”) Figure 2, which includes data going back to 1966, shows that the current decline, measured in absolute numbers, is—as of 2015—still modest compared with the decline in degree completions that English and history experienced in the 1970s.
Fig. 2.

In relative terms, however, as a share of all bachelor’s degree completions, the humanities fields stand near or below the lows reached in the 1980s. English has seen its share erode steadily since 1993, falling to 2.24 of every 100 bachelor’s degrees in 2015, considerably below its prior low point of 3.19, reached in 1983. History has fallen to 1.47 of every 100, also below its prior low point, 1.63, reached in 1985 (fig. 3).
Fig. 3.

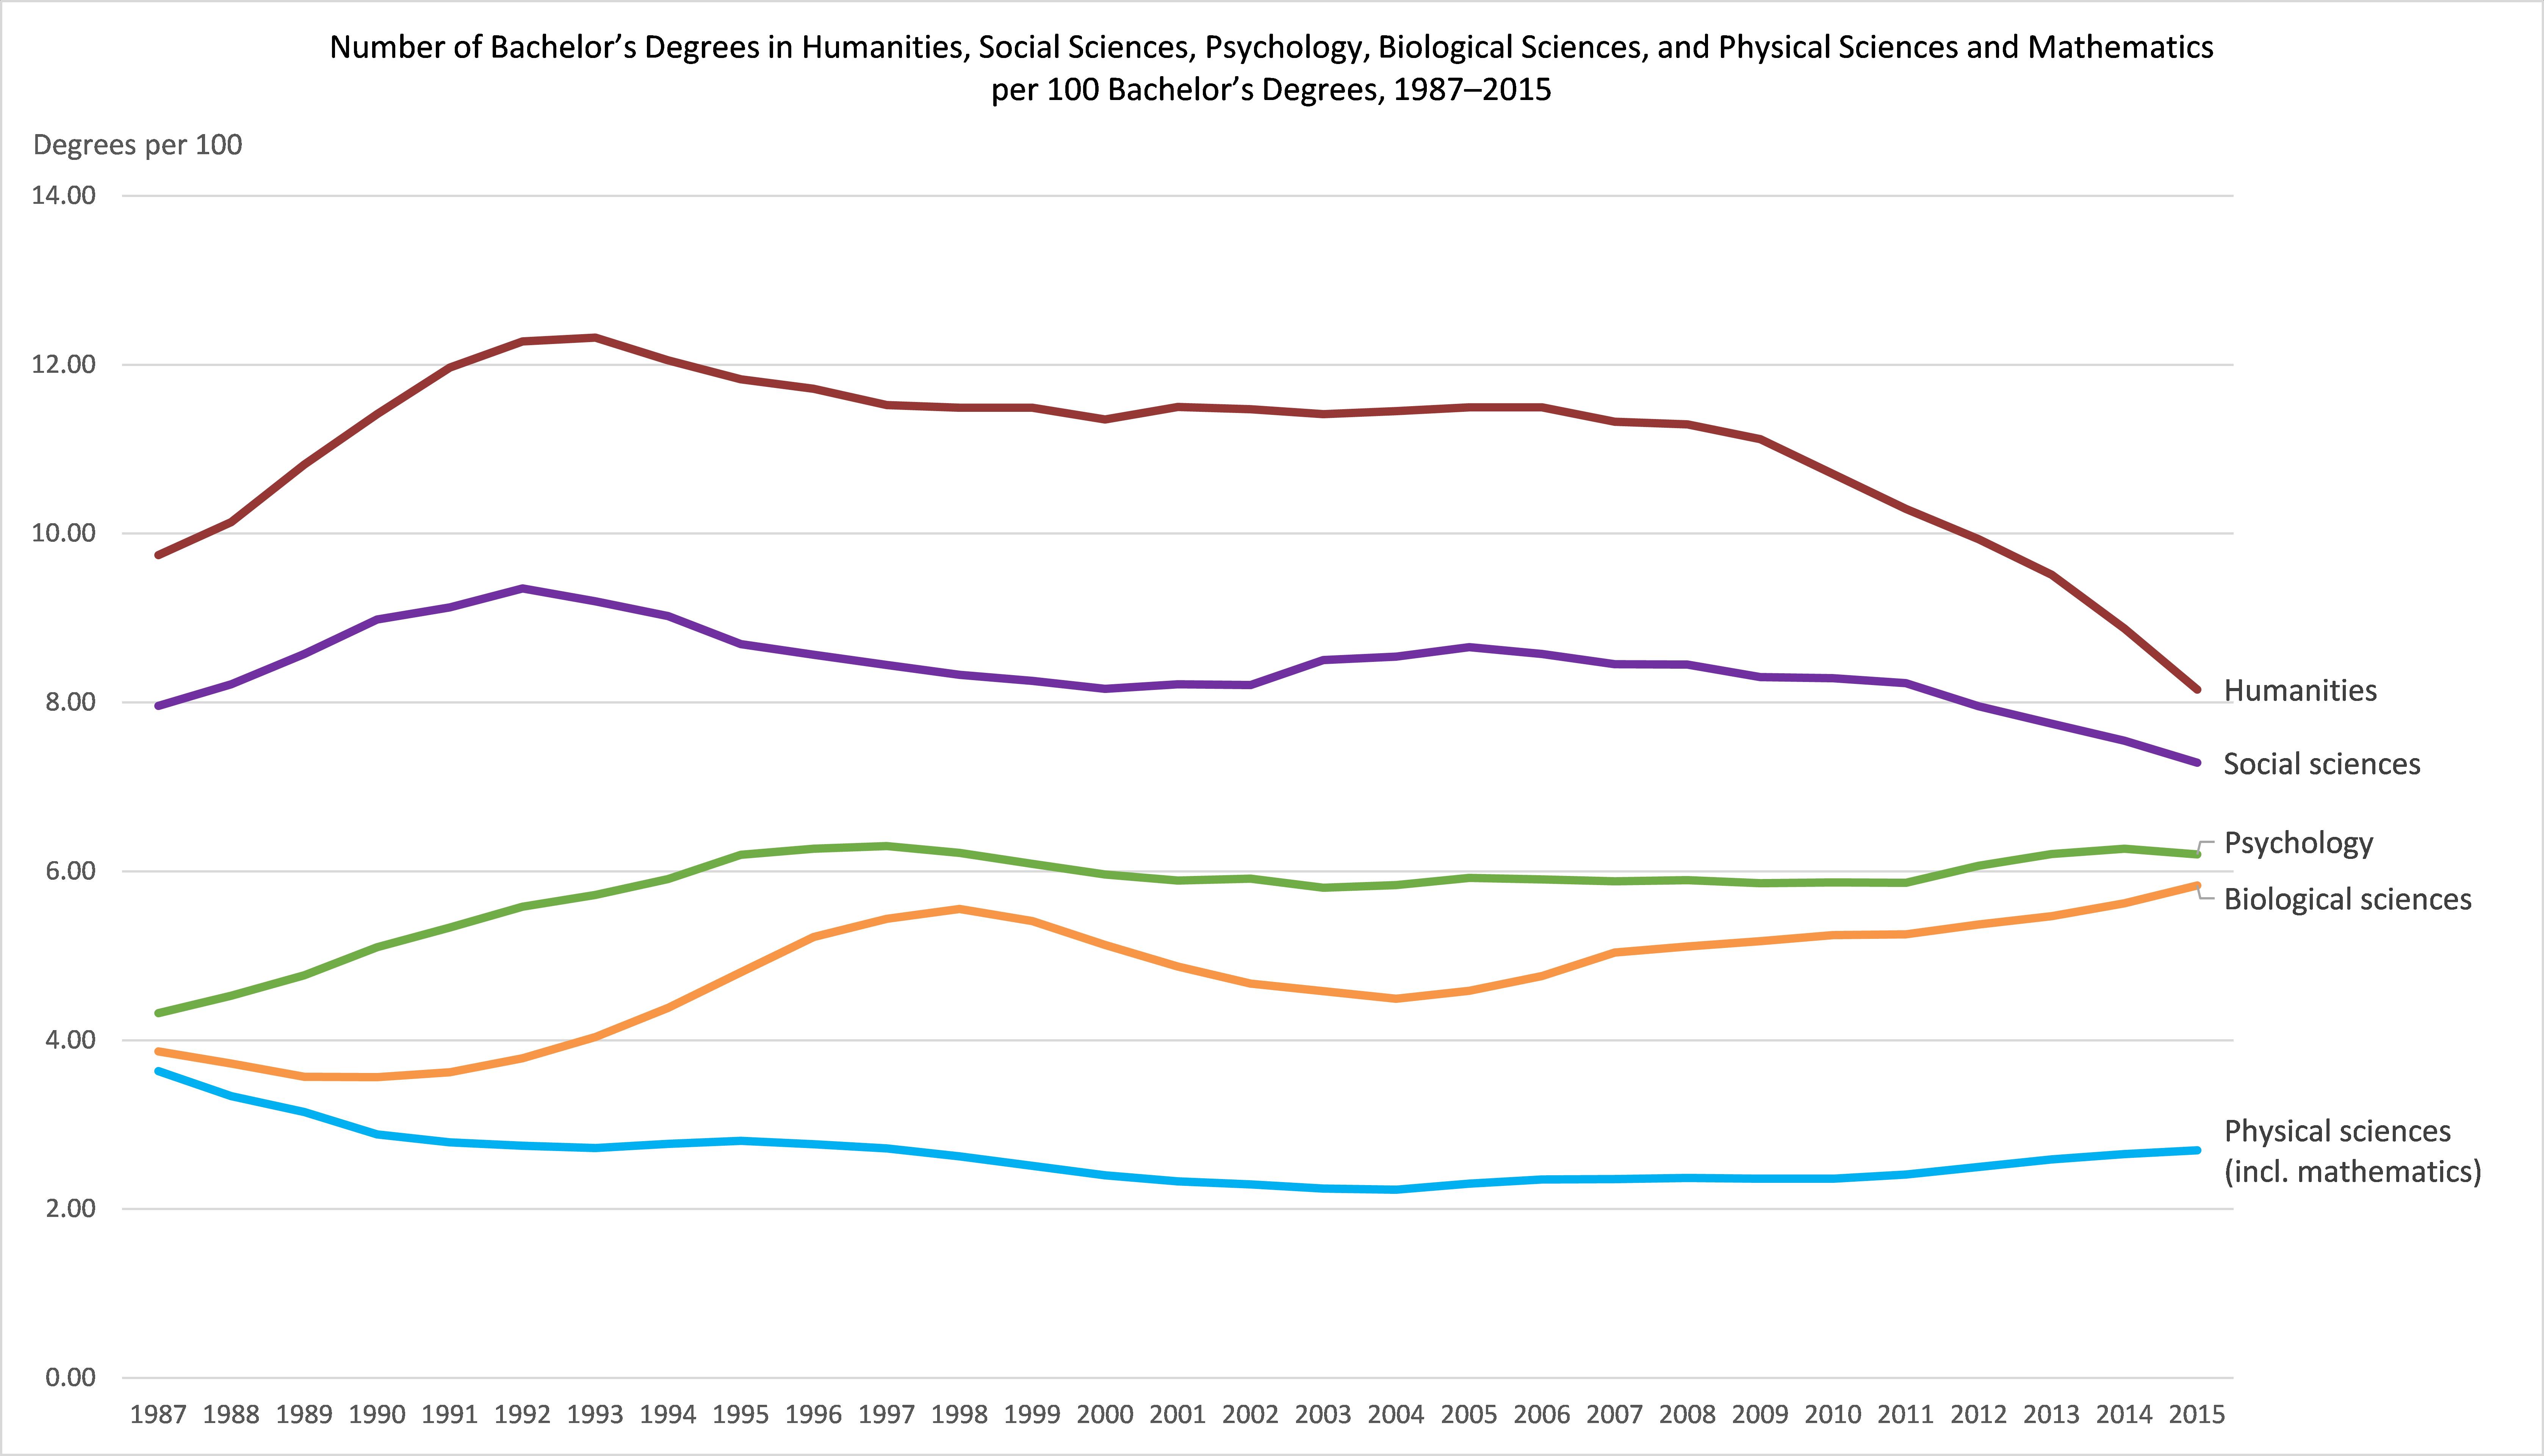
Looking at the humanities alongside the social sciences and sciences (the other core liberal arts disciplines) reveals an interesting trend. Over the 1987–2015 period, the humanities, biological sciences, and psychology and other social sciences have moved closer to one another in the share of bachelor’s degrees each area of study awards (fig. 4). In 1987 the physical sciences, biological sciences, and psychology clustered close to one another, each of them awarding about 4 of every 100 bachelor’s degrees. By 2000 the biological sciences and psychology had each increased their shares to about 6 of every 100 degrees, while the share of the physical sciences fell to just over 2 of every 100 degrees and the share of the humanities grew to just under 12 per 100. The quickened flow of students out of the humanities after 2009 meant that by 2015 the humanities were conferring 3.4 fewer bachelor’s degrees per 100 than they had a decade earlier, in 2006. As a result, the gap between the humanities and the social sciences narrowed from 2.9 degrees per 100 in 2006 to 0.9 per 100 in 2015. The gap between the biological sciences and social sciences narrowed from 3.8 degrees per 100 in 2006 to 1.5 per 100 in 2015. Put another way, in the short span of ten years, from 2006 to 2015, the difference
between the humanities and biological sciences in the number of bachelor’s degrees per 100 awarded in each field shrank by almost two-thirds, from 6.7 degrees per 100 in 2006 to 2.3 degrees per 100 in 2015. With the exception of the physical sciences, in 2015 the arts and sciences disciplines claimed shares of bachelor’s degree completions that are far closer to one another than they had been even as recently as 2008.
Fig. 4.
But this redistribution of bachelor’s degree awards within the liberal arts and sciences pales in comparison with changes occurring in professional fields that have clearer ties to specific occupations. Most striking is the astonishing growth in bachelor’s degrees conferred in health professions since 2004. From 1987 to 2004, health professions conferred 6.2 of every 100 bachelor’s degrees, on average. After 2004, that share grew sharply, to 8.3 of every 100 bachelor’s degrees, on average, for the years 2005 to 2015 (fig. 5).
Fig. 5.

Of equal moment is the flow of students out of education, which over the eighteen years from 1987 to 2004 conferred, on average, 9.1 of every 100 bachelor’s degrees; that number shrank to 6.3 of every 100, on average, for the eleven years from 2005 to 2015 (fig. 6).
Fig. 6.

By 2015, education had fallen to under 5.0 of every 100 bachelor’s degrees, and health professions had grown to over 11.5 of every 100 bachelor’s degrees.
From 1987 to 2006 visual and performing arts saw its share of bachelor’s degrees grow steadily, and it has largely sustained its position since 2006 (fig. 7). Some degree programs categorized under visual and performing arts clearly belong to the academic humanities (art history and film studies, for example). Others signal student interest in hands-on creative work that results in tangible products or performances, whether with a professional aspiration or as a personal avocation (visual and performing arts includes degree programs in acting; dance; music performance; photography and cinematography; and studio arts and painting, sculpture, printmaking, ceramics, metal arts, and weaving). Student interest in these programs in the arts surely shares something in common with the appeal of creative writing that many English departments report draws students to the English major now.
Fig. 7.
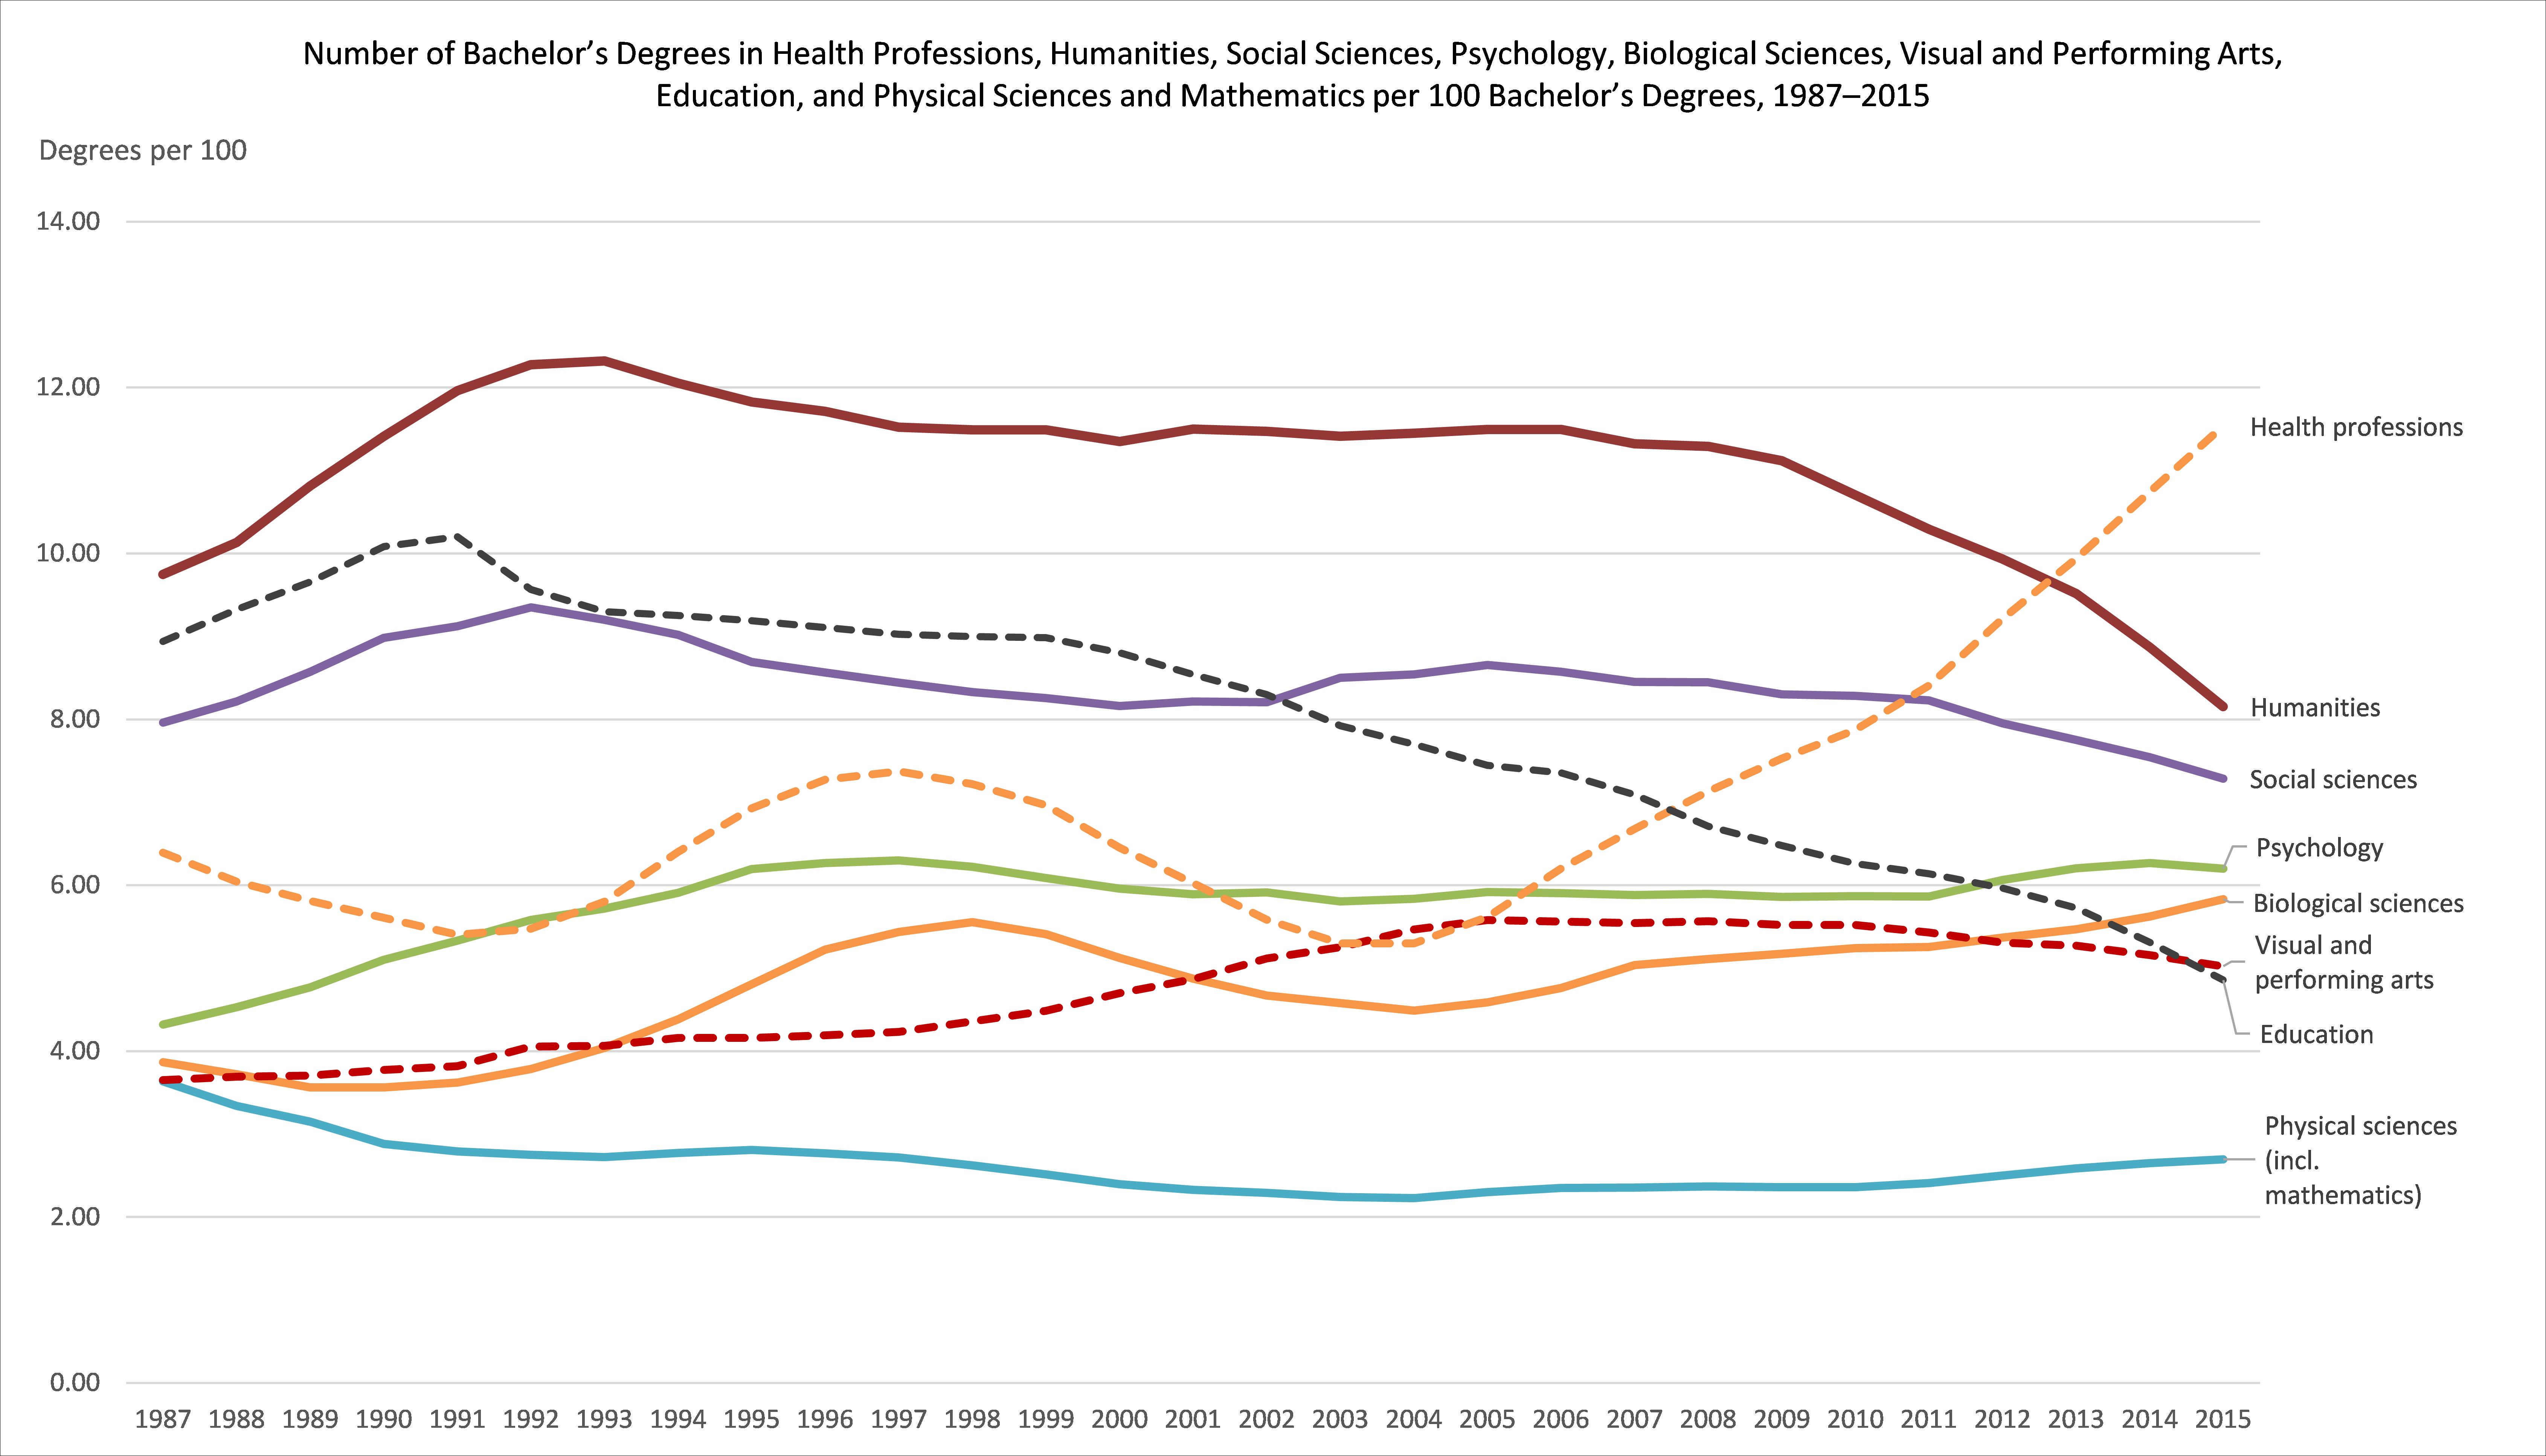
Figure 8 breaks out English, history, and languages other than English to facilitate comparison of trends in the share of degree completions for these humanities fields with those for the six other areas of study that are the focus of this post.
Fig. 8.

The parallel trend lines for English and education may be related, given the historic ties between the undergraduate English major and student aspirations to careers in secondary school teaching. This conjecture returns us to the questions we began with: How do we make the case for the wide-ranging benefits study in the humanities offers for students’ lives and career prospects? And what terms do we use to refocus public discourse on the contributions a humanities education makes to the greater social good as well as to students’ individual economic and career success? To address these questions, we might start in the classroom, encouraging students to reflect with intention on how the academic work they are doing today is exercising capabilities that will serve them well tomorrow, both in their working lives and as citizens.
David Laurence
Note
The National Science Foundation’s WebCASPAR Web site provides easy access to time-series data on degree completions, compiled from the degree completions component of the United States Department of Education’s IPEDS survey series. The WebCASPAR interface allows users to specify a wide range of variables and levels of granularity, from degree levels (associate to doctorate) to individual institutions or groups of institutions to national data in the aggregate. WebCASPAR completions totals include United States territories and outlying areas along with the fifty states and the District of Columbia. The figures in this post were created by the author from queries to WebCASPAR that asked for bachelor’s degree completions from 1987 to 2015 by two-digit CIP code and for bachelor’s degree completions from 1966 to 2015 by detailed academic discipline. Derivative calculations, such as the number of degrees per 100, are the author’s.